15.6 Kalman Filtering for Pairs Trading
A key component in pairs trading is the construction of a mean-reverting spread \[ z_{t} = y_{1t} - \gamma \, y_{2t} = \mu + r_t, \] where \(\gamma\) is the hedge ratio, \(\mu\) is the mean, and \(r_t\) is the zero-mean residual. Then the trading strategy will properly size the trade depending on the distance of the spread \(z_{t}\) from the equilibrium value \(\mu\).
Construction of the spread requires careful estimation of the hedge ratio \(\gamma\), as well as the mean of the spread \(\mu\). The traditional way is to employ least squares regression. In practice, the hedge ratio and the mean will slowly change over time and then the least squares solution should be recomputed on a rolling-window basis. A more flexible alternative is to employ a time-varying modeling and estimation technique based on state-space modeling and the Kalman filter (Chan, 2013; Feng and Palomar, 2016).
15.6.1 Spread Modeling via Least Squares
The method of least squares (LS) dates back to 1795 when Gauss used it to study planetary motions. It deals with the linear model \(\bm{y} = \bm{A}\bm{x} + \bm{\epsilon}\) by solving the problem (Kay, 1993; Scharf, 1991) \[ \begin{array}{ll} \underset{\bm{x}}{\textm{minimize}} & \left\Vert \bm{y} - \bm{A}\bm{x} \right\Vert_2^2, \end{array} \] whose solution gives the least squares estimate \(\hat{\bm{x}}=\left(\bm{A}^\T\bm{A}\right)^{-1}\bm{A}^\T\bm{y}\). In addition, the covariance matrix of the estimate \(\hat{\bm{x}}\) is given by \(\sigma_\epsilon^2\left(\bm{A}^\T\bm{A}\right)^{-1}\), where \(\sigma_\epsilon^2\) is the variance of the residual \(\bm{\epsilon}\) (in practice, the variance of the estimated residual \(\hat{\bm{\epsilon}} = \bm{y} - \bm{A}\hat{\bm{x}}\) can be used instead).
In our context of spread modeling, we want to fit \(y_{1t} \approx \mu + \gamma \, y_{2t}\) based on \(T\) observations, so the LS formulation becomes \[ \begin{array}{ll} \underset{\mu,\gamma}{\textm{minimize}} & \left\Vert \bm{y}_1 - \left(\mu \bm{1} + \gamma \, \bm{y}_2\right) \right\Vert_2^2, \end{array} \] where the vectors \(\bm{y}_1\) and \(\bm{y}_2\) contain the \(T\) observations of the two time series, and \(\bm{1}\) is the all-ones vector. The solution gives the estimates \[ \begin{bmatrix} \begin{array}{ll} \hat{\mu} \\ \hat{\gamma} \end{array} \end{bmatrix} = \begin{bmatrix} \begin{array}{ll} \bm{1}^\T\bm{1} & \bm{1}^\T\bm{y}_2\\ \bm{y}_2^\T\bm{1} & \bm{y}_2^\T\bm{y}_2 \end{array} \end{bmatrix}^{-1} \begin{bmatrix} \begin{array}{ll} \bm{1}^\T\bm{y}_1\\ \bm{y}_2^\T\bm{y}_1 \end{array} \end{bmatrix}. \]
In practice, it is more convenient to first remove the mean of \(\bm{y}_1\) and \(\bm{y}_2\) to produce the centered versions \(\bar{\bm{y}}_1\) and \(\bar{\bm{y}}_2\), then estimate the hedge ratio as \[ \hat{\gamma} = \frac{\bar{\bm{y}}_2^\T \bar{\bm{y}}_1}{\bar{\bm{y}}_2^\T \bar{\bm{y}}_2}, \] and finally compute the sample mean of \(\bm{y}_1 - \hat{\gamma} \, \bm{y}_2\): \[ \hat{\mu} = \frac{\bm{1}^\T(\bm{y}_1 - \hat{\gamma} \, \bm{y}_2)}{T}. \]
The variance of these estimates is given by \[ \begin{array}{ll} \textm{Var}[\hat{\gamma}] &= \frac{1}{T} \; \sigma_\epsilon^2 / \sigma_2^2,\\ \textm{Var}[\hat{\mu}] &= \frac{1}{T} \;\sigma_\epsilon^2, \end{array} \] where \(\sigma_2^2\) is the variance of \(\bm{y}_2\) and \(\sigma_\epsilon^2\) is the variance of the residual \(\bm{\epsilon}\).
It is important to reiterate that in practice the hedge ratio and the mean will slowly change over time, as denoted by \(\gamma_t\) and \(\mu_t\), and the least squares solution must be recomputed on a rolling-window basis (based on a lookback window of past samples). Nevertheless, this time-varying case can also be handled with Kalman filtering, as described next.
15.6.2 Primer on the Kalman Filter
State-space modeling provides a unified framework for treating a wide range of problems in time series analysis. It can be thought of as a universal and flexible modeling approach with a very efficient algorithm, the Kalman filter. The basic idea is to assume that the evolution of the system over time is driven by a series of unobserved or hidden values, which can only be measured indirectly through observations of the system output. This model can be used for filtering, smoothing, and forecasting. Here we provide a concise summary; more details on state-space modeling and Kalman filtering can be found in Section 4.2 of Chapter 4.
The Kalman filter, which was employed by NASA during the 1960s in the Apollo program, now boasts a vast array of technological applications. It is commonly utilized in the guidance, navigation, and control of vehicles, including aircraft, spacecraft, and maritime vessels. It has also found applications in time series analysis, signal processing, and econometrics. More recently, it has become a key component in robotic motion planning and control, as well as trajectory optimization.
State-space models and Kalman filtering are mature topics with excellent textbooks available such as the classical references B. D. O. Anderson and Moore (1979) and Durbin and Koopman (2012), which was originally published in 2001. Other textbook references on time series and the Kalman filter include Brockwell and Davis (2002), Shumway and Stoffer (2017), A. Harvey (1989) and, in particular, for financial time series, Zivot et al. (2004), Tsay (2010), Lütkepohl (2007), and A. Harvey and Koopman (2009).
Mathematically, the Kalman filter is based on the following linear Gaussian state-space model with discrete time \(t=1,\dots,T\) (Durbin and Koopman, 2012): \[ \qquad\qquad \begin{aligned} \bm{y}_t &= \bm{Z}_t\bm{\alpha}_t + \bm{\epsilon}_t\\ \bm{\alpha}_{t+1} &= \bm{T}_t\bm{\alpha}_t + \bm{\eta}_t \end{aligned} \quad \begin{aligned} & \textm{(observation equation)},\\ & \textm{(state equation)}, \end{aligned} \] where \(\bm{y}_t\) denotes the observations over time with observation matrix \(\bm{Z}_t\), \(\bm{\alpha}_t\) represents the unobserved or hidden internal state with state transition matrix \(\bm{T}_t\), and the two noise terms \(\bm{\epsilon}_t\) and \(\bm{\eta}_t\) are Gaussian distributed with zero mean and covariance matrices \(\bm{H}\) and \(\bm{Q}\), respectively, that is, \(\bm{\epsilon}_t \sim \mathcal{N}(\bm{0},\bm{H})\) and \(\bm{\eta}_t \sim \mathcal{N}(\bm{0},\bm{Q})\). The initial state can be modeled as \(\bm{\alpha}_1 \sim \mathcal{N}(\bm{a}_1,\bm{P}_1)\). Mature and efficient software implementations are readily available (Helske, 2017; Holmes et al., 2012; Petris and Petrone, 2011; Tusell, 2011).66
The parameters of the state-space model (i.e., \(\bm{Z}_t\), \(\bm{T}_t\), \(\bm{H}\), \(\bm{Q}\), \(\bm{a}_1\), and \(\bm{P}_1\)) can be either provided by the user (if known) or inferred from the data with algorithms based on the maximum likelihood method. Again, mature and efficient software implementations are available for this parameter fitting (Holmes et al., 2012).67
To be more precise, the Kalman filter is a very efficient algorithm to optimally characterize the distribution of the hidden state at time \(t\), \(\bm{\alpha}_t\), in a causal manner. In particular, \(\bm{\alpha}_{t|t-1}\) and \(\bm{\alpha}_{t|t}\) denote the expected value given the observations up to time \(t-1\) and \(t\), respectively. These quantities can be efficiently computed using a “forward pass” algorithm that goes from \(t=1\) to \(t=T\) in a recursive way, so that it can operate in real time (Durbin and Koopman, 2012).
15.6.3 Spread Modeling via Kalman
In our context of spread modeling, we want to model \(y_{1t} \approx \mu_t + \gamma_t \, y_{2t}\), where now \(\mu_t\) and \(\gamma_t\) change slowly over time. This can be done conveniently via a state-space modeling by identifying the hidden state as \(\bm{\alpha}_t = \left(\mu_t, \gamma_t\right)\), leading to \[\begin{equation} \begin{aligned} y_{1t} &= \begin{bmatrix} 1 & y_{2t} \end{bmatrix} \begin{bmatrix} \mu_t\\ \gamma_t \end{bmatrix} + \epsilon_t,\\ \begin{bmatrix} \mu_{t+1}\\ \gamma_{t+1} \end{bmatrix} &= \begin{bmatrix} 1 & 0\\ 0 & 1 \end{bmatrix} \begin{bmatrix} \mu_t\\ \gamma_t \end{bmatrix} + \begin{bmatrix} \eta_{1t}\\ \eta_{2t} \end{bmatrix} , \end{aligned} \tag{15.3} \end{equation}\] where all the noise components are independent and distributed as \(\epsilon_t \sim \mathcal{N}(0,\sigma_\epsilon^2)\), \(\eta_{1t} \sim \mathcal{N}(0,\sigma_{\mu}^2)\), and \(\eta_{2t} \sim \mathcal{N}(0,\sigma_{\gamma}^2)\), the state transition matrix is the identity \(\bm{T}=\bm{I}\), the observation matrix is \(\bm{Z}_t=\begin{bmatrix} 1 & y_{2t} \end{bmatrix}\), and the initial states are \(\mu_{1} \sim \mathcal{N}\left(\bar{\mu},\sigma_{\mu,1}^2\right)\) and \(\gamma_{1} \sim \mathcal{N}\left(\bar{\gamma},\sigma_{\gamma,1}^2\right)\).
The normalized spread, with leverage one (see (15.2)), can then be obtained as \[ z_{t} = \frac{1}{1 + \gamma_{t|t-1}} \left(y_{1t} - \gamma_{t|t-1} \, y_{2t} - \mu_{t|t-1}\right), \] where \(\mu_{t|t-1}\) and \(\gamma_{t|t-1}\) are the hidden states estimated by the Kalman algorithm.
The model parameters \(\sigma_\epsilon^2\), \(\sigma_\mu^2\), and \(\sigma_\gamma^2\) (and the initial states) can be determined by simple heuristics or optimally estimated from the data (more computationally demanding). For example, one can use initial training data of \(T^\textm{LS}\) samples to estimate \(\mu\) and \(\gamma\) via least squares, \(\mu^\textm{LS}\) and \(\gamma^\textm{LS}\), obtaining the estimated residual \(\epsilon_t^\textm{LS}\). Then the following provide an effective heuristic for the state-space model parameters: \[ \begin{aligned} \sigma_\epsilon^2 &= \textm{Var}\left[\epsilon_t^\textm{LS}\right],\\ \mu_1 &\sim \mathcal{N}\left(\mu^\textm{LS}, \frac{1}{T^\textm{LS}}\textm{Var}\left[\epsilon_t^\textm{LS}\right]\right),\\ \gamma_1 &\sim \mathcal{N}\left(\gamma^\textm{LS}, \frac{1}{T^\textm{LS}}\frac{\textm{Var}\left[\epsilon_t^\textm{LS}\right]}{\textm{Var}\left[y_{2t}\right]}\right),\\ \sigma_\mu^2 &= \alpha \times \textm{Var}\left[\epsilon_t^\textm{LS}\right],\\ \sigma_\gamma^2 &= \alpha \times \frac{\textm{Var}\left[\epsilon_t^\textm{LS}\right]}{\textm{Var}\left[y_{2t}\right]}, \end{aligned} \] where the hyper-parameter \(\alpha\) determines the ratio of the variability of the slowly time-varying hidden states to the variability of the spread.
The state-space model of the spread in (15.3) can be extended in different ways to potentially improve the performance. One simple extension involves modeling not only the hedge ratio but also its momentum or velocity. This can be done by expanding the hidden state to \(\bm{\alpha}_t = \left(\mu_t, \gamma_t, \dot{\gamma}_t\right)\), which leads to the state-space model \[\begin{equation} \begin{aligned} y_{1t} &= \begin{bmatrix} 1 & y_{2t} & 0 \end{bmatrix} \begin{bmatrix} \mu_t\\ \gamma_t\\ \dot{\gamma}_t \end{bmatrix} + \epsilon_t,\\ \begin{bmatrix} \mu_{t+1}\\ \gamma_{t+1}\\ \dot{\gamma}_{t+1} \end{bmatrix} &= \begin{bmatrix} 1 & 0 & 0\\ 0 & 1 & 1\\0 & 0 & 1 \end{bmatrix} \begin{bmatrix} \mu_t\\ \gamma_t\\ \dot{\gamma}_t \end{bmatrix} + \bm{\eta}_{t}. \end{aligned} \tag{15.4} \end{equation}\] This model is meant to make \(\gamma_{t}\) less noisy; with the parameters used in the numerical experiments below, however, it gave no appreciable improvement over the basic model, so it is not pursued further.
Another extension of the state-space modeling in (15.3) under the concept of partial cointegration is to model the spread with an autoregressive component (Clegg and Krauss, 2018). This can be done by defining the hidden state as \(\bm{\alpha}_t = \left(\mu_t, \gamma_t, \epsilon_t\right)\), leading to \[\begin{equation} \begin{aligned} y_{1t} &= \begin{bmatrix} 1 & y_{2t} & 1 \end{bmatrix} \begin{bmatrix} \mu_t\\ \gamma_t\\ \epsilon_t \end{bmatrix},\\ \begin{bmatrix} \mu_{t+1}\\ \gamma_{t+1}\\ \epsilon_{t+1} \end{bmatrix} &= \begin{bmatrix} 1 & 0 & 0\\ 0 & 1 & 0\\0 & 0 & \rho \end{bmatrix} \begin{bmatrix} \mu_t\\ \gamma_t\\ \epsilon_t \end{bmatrix} + \bm{\eta}_{t}, \end{aligned} \tag{15.5} \end{equation}\] where \(\rho\) is a parameter to be estimated satisfying \(|\rho|<1\) (or fixed to some reasonable value like \(\rho=0.9)\).
15.6.4 Numerical Experiments
We now repeat the pairs trading experiments with market data during 2013–2022 as in Section 15.5. As before, the \(z\)-score is computed on a rolling-window basis with a lookback period of six months and pairs trading is implemented via the thresholded strategy with a threshold of \(s_0=1\). The difference is that we now employ two different methods to track the hedge ratio over time: (i) rolling least squares with lookback period of two years and (ii) the Kalman filter based on the basic model (15.3) with \(\alpha=5\times10^{-5}\). This value of \(\alpha\) has been fixed by trial and error (without transaction costs) and could be further optimized. With random-walk states, the Kalman filter can be seen as a recursive least squares with a forgetting mechanism, where \(\alpha\) controls how fast the past data is forgotten: a larger \(\alpha\) implies a faster tracking and a smaller variance of the spread. In principle, all the parameters in the state-space model can also be learned to better fit the data via maximum likelihood estimation methods, although a better fit does not necessarily translate into a better trading performance.
Market Data: EWA and EWC
We first consider the two ETFs EWA and EWC, which track the performance of the Australian and Canadian economies, respectively. As concluded in Section 15.5, EWA and EWC are cointegrated, and pairs trading was evaluated in Section 15.5 based on least squares. We now experiment with the Kalman filter to see what improvement can be obtained.
Figure 15.21 shows the estimated hedge ratios over time, which should be quite constant since the assets are cointegrated. We can observe that the rolling least squares is very noisy with the value wildly varying between 0.6 and 1.2 (of course a longer lookback period could be used, but then it would not adapt fast enough if the true hedge ratio changed). The Kalman filter, on the other hand, is much more stable with the value between 0.55 and 0.65.
Figure 15.22 presents the spreads resulting from the two methods. It is quite apparent that the spread from the Kalman filter is much more stationary and mean reverting than the one from the rolling least squares. One important point to notice is that the variance of the spread obtained from the Kalman filter depends on the choice of \(\alpha\): if the spread variance becomes too small, then the profit may totally disappear after taking into account transaction costs, so care has to be taken with this choice.
Finally, Figure 15.23 provides the cumulative returns obtained by the two methods (ignoring transaction costs, and computed with the weights held during each period as discussed in Section 15.3.2). Both strategies are profitable, ending at about 0.51 (rolling least squares) and 0.78 (Kalman). The two curves are, however, close until early 2020, when a large jump takes place (the COVID-19 market turmoil) that the Kalman filter captures much better; most of the difference in the final value comes from that single episode. The Kalman filter tracks the hedge ratio more smoothly and gives a spread with a smaller variance, but it also trades more: its turnover is about 4.5 times that of rolling least squares (0.23 versus 0.05 per day, counting changes of both the signal and the hedge ratio), so transaction costs hurt it more. With a cost of 5 basis points on the traded amount, the final values become 0.56 (Kalman) and 0.46 (rolling least squares), and with 10 basis points the ranking is reversed (0.33 versus 0.41). Again, it is important to reiterate that special care has to be taken in practice with the choice of \(\alpha\) so that the spread variance is large enough to provide a profit after transaction costs.
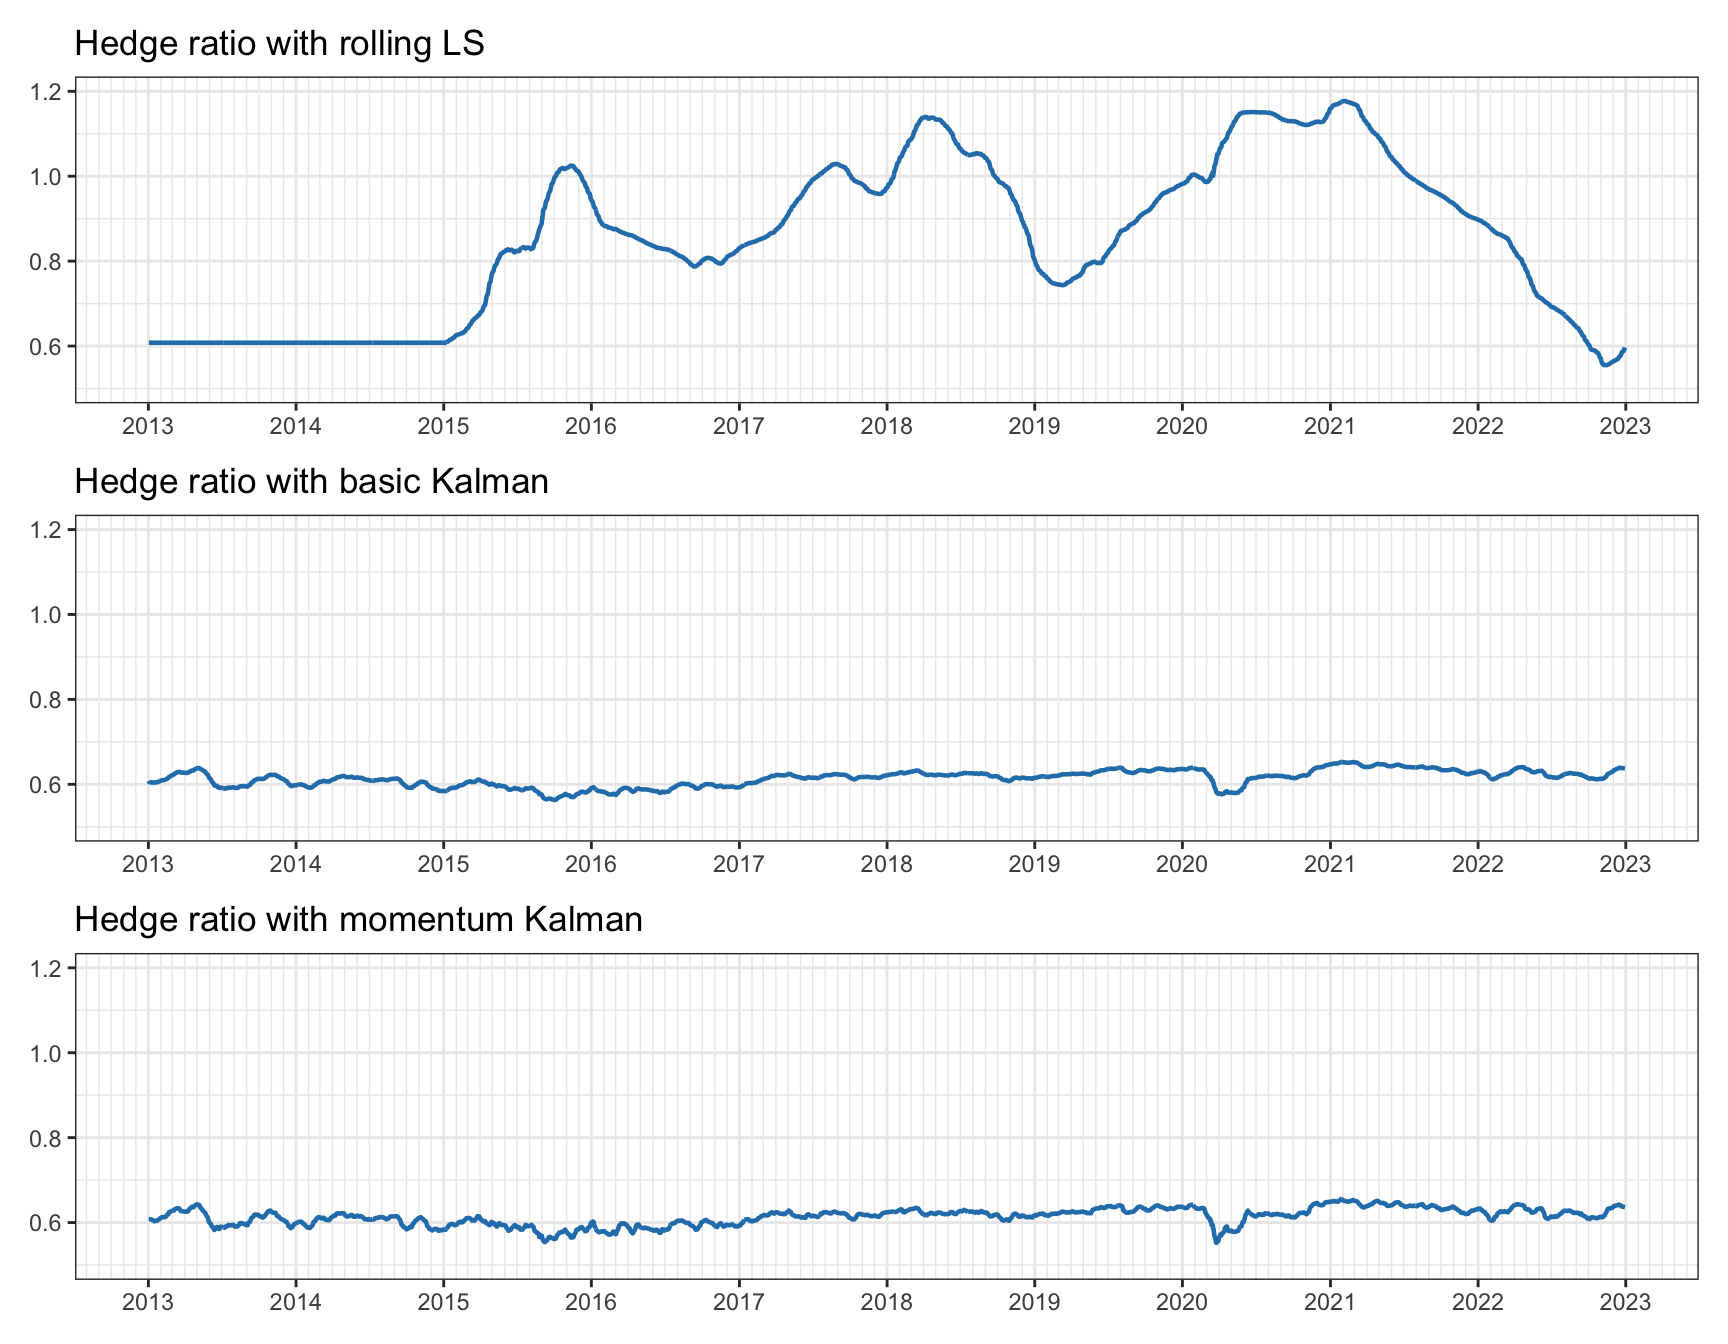
Figure 15.21: Tracking of hedge ratio for pairs trading on EWA–EWC.
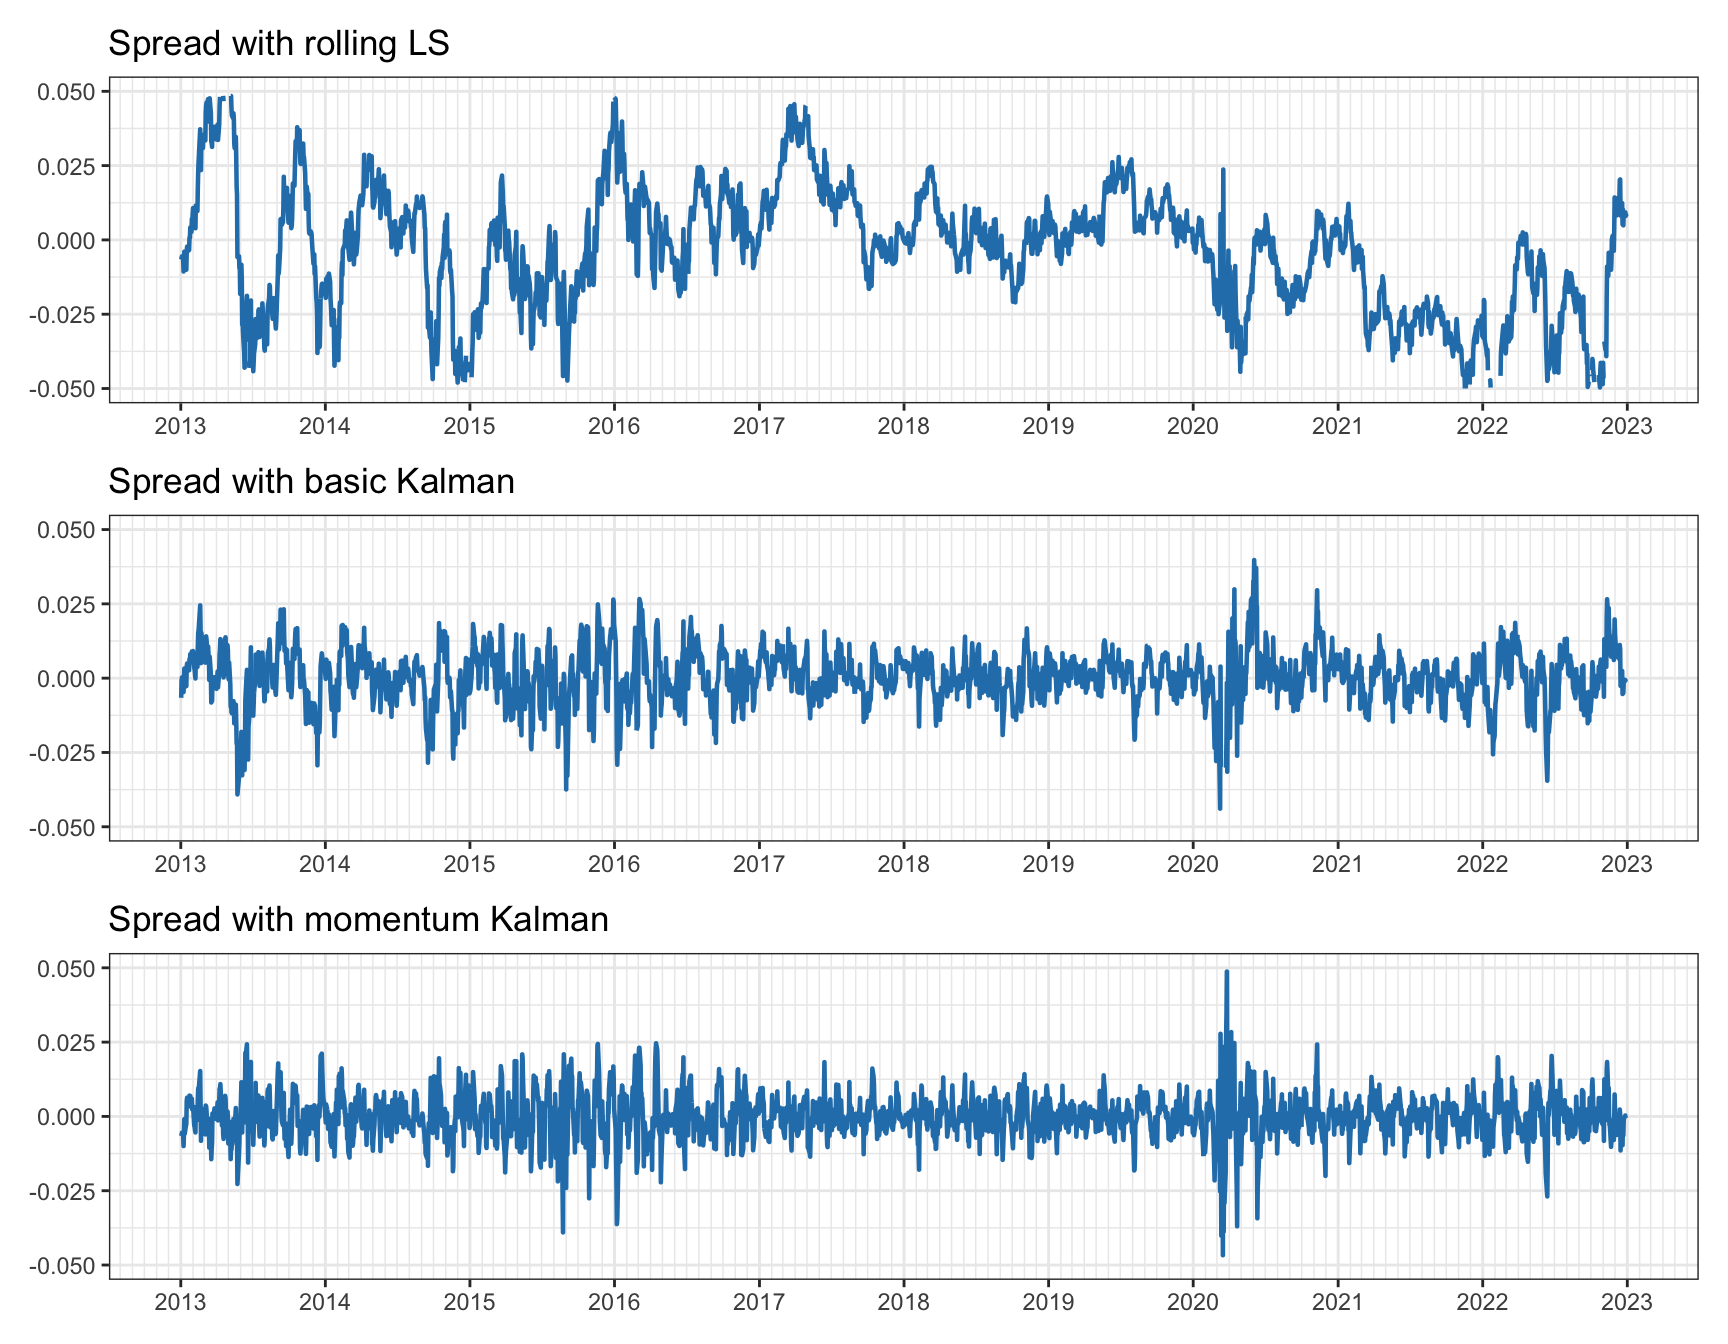
Figure 15.22: Spread for pairs trading on EWA–EWC.
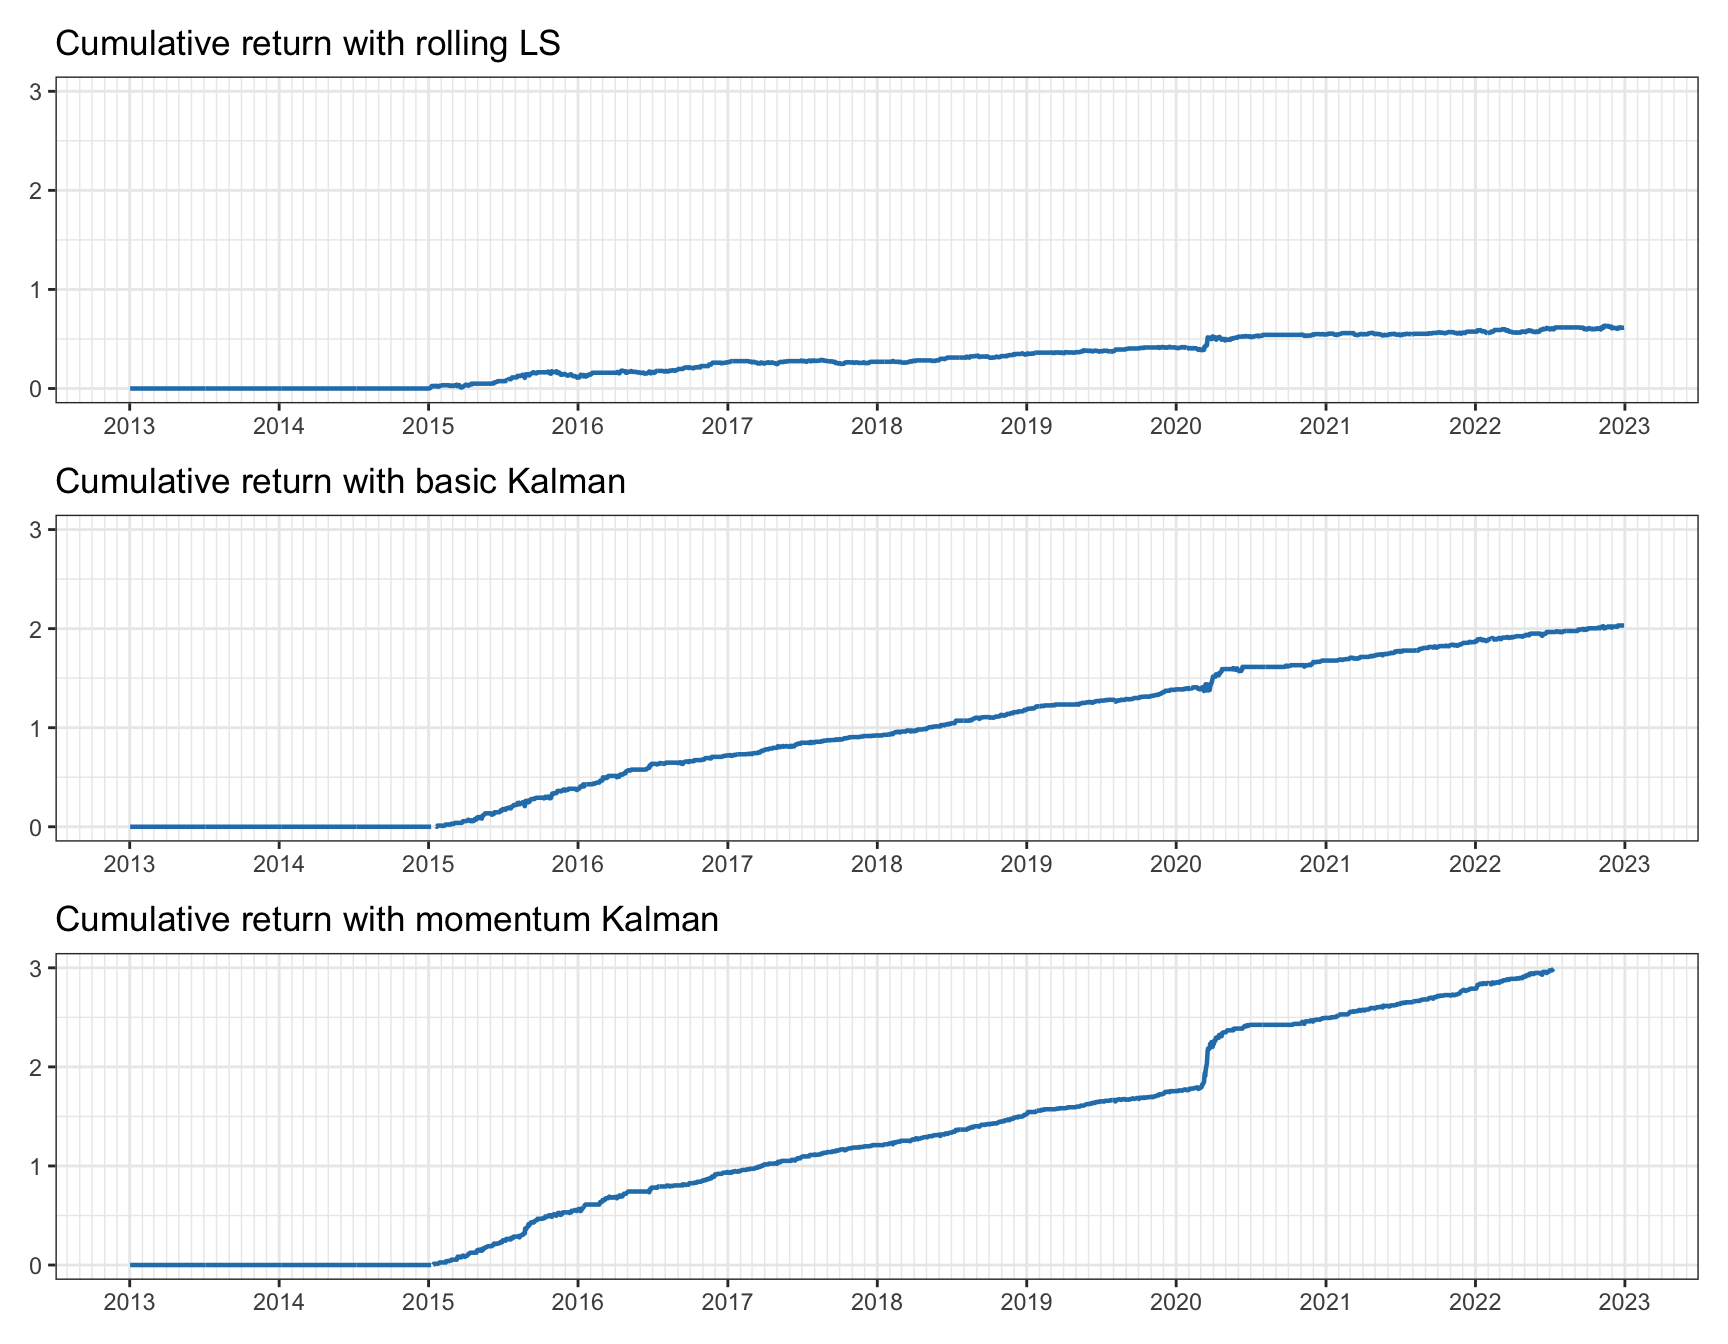
Figure 15.23: Cumulative return for pairs trading on EWA–EWC.
Market Data: KO and PEP
Next, we revisit pairs trading with the stocks Coca-Cola (KO) and Pepsi (PEP). As concluded from the cointegration tests in Section 15.4, they do not seem to be cointegrated. In addition, from the trading experiments in Section 15.5, profitability was dubious as indicated in Figures 15.19 and 15.18. We now look at whether the Kalman filter changes the picture.
Figure 15.24 shows the estimated hedge ratios over time. Again, we can observe that rolling least squares is noisy and not very consistent, whereas the Kalman filter is stable while still reacting to the big change that happens in early 2020 (perhaps due to the COVID-19 pandemic).
Figure 15.25 gives the spreads, and one can clearly appreciate a significant difference between the two methods. Observe early 2020: rolling least squares loses the tracking and cointegration is clearly lost, whereas the Kalman filter is able to track after a momentary loss reflected in the shock on the spread.
Finally, Figure 15.26 provides the cumulative returns. In this case neither method produces a convincing profit: the final values are about 0.13 (rolling least squares) and 0.04 (Kalman), both with sizable drawdowns. Moreover, one cannot forget that transaction costs have not been considered and the Kalman filter trades about five times as much as rolling least squares: with a cost of just 2 basis points on the traded amount, the final value is 0.11 for rolling least squares and already negative (\(-0.03\)) for the Kalman filter. This is consistent with KO and PEP not being cointegrated: better tracking of the hedge ratio cannot create a mean-reverting spread where there is none. The conclusion is that Kalman filtering is a useful tool to track a cointegration relationship when it exists, but it cannot create one.
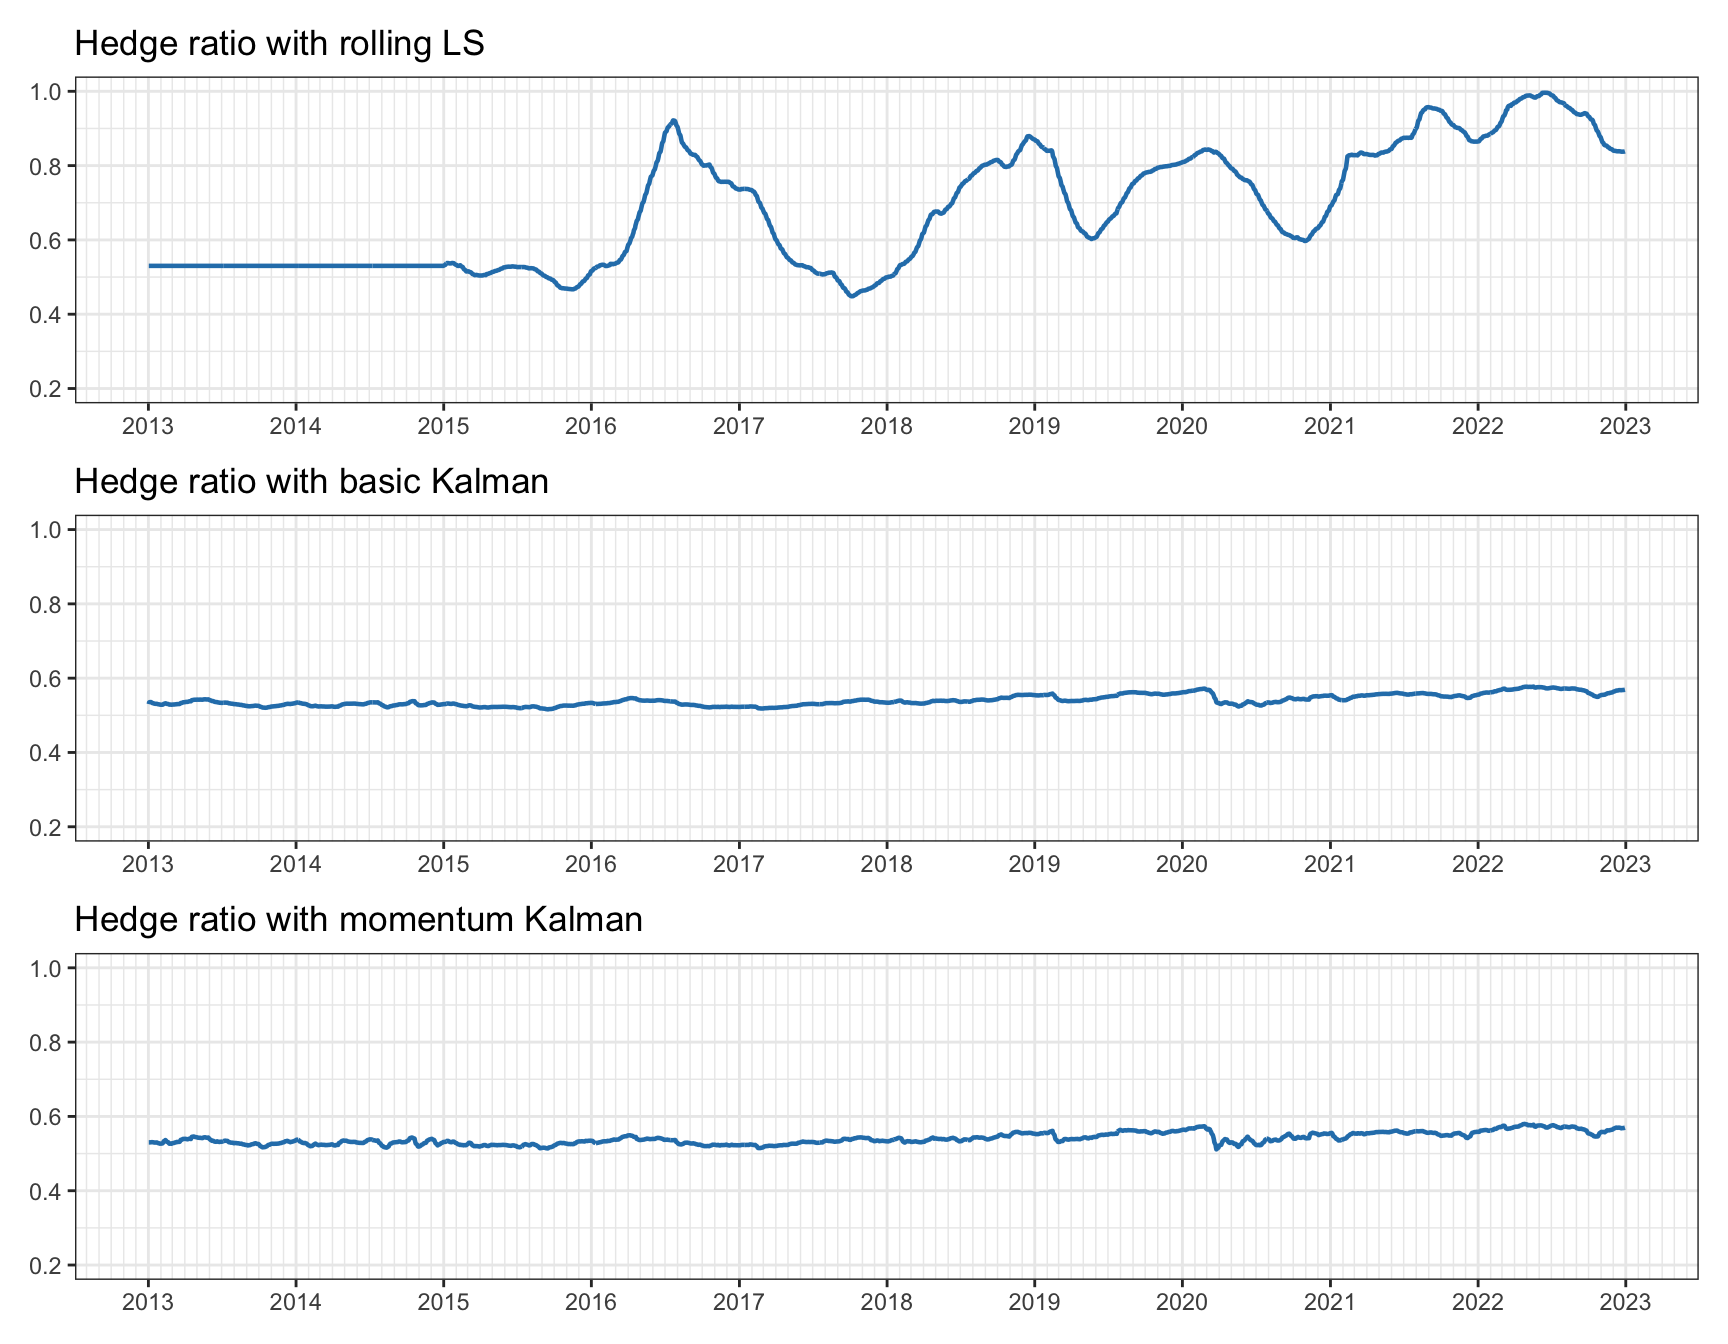
Figure 15.24: Tracking of hedge ratio for pairs trading on KO–PEP.
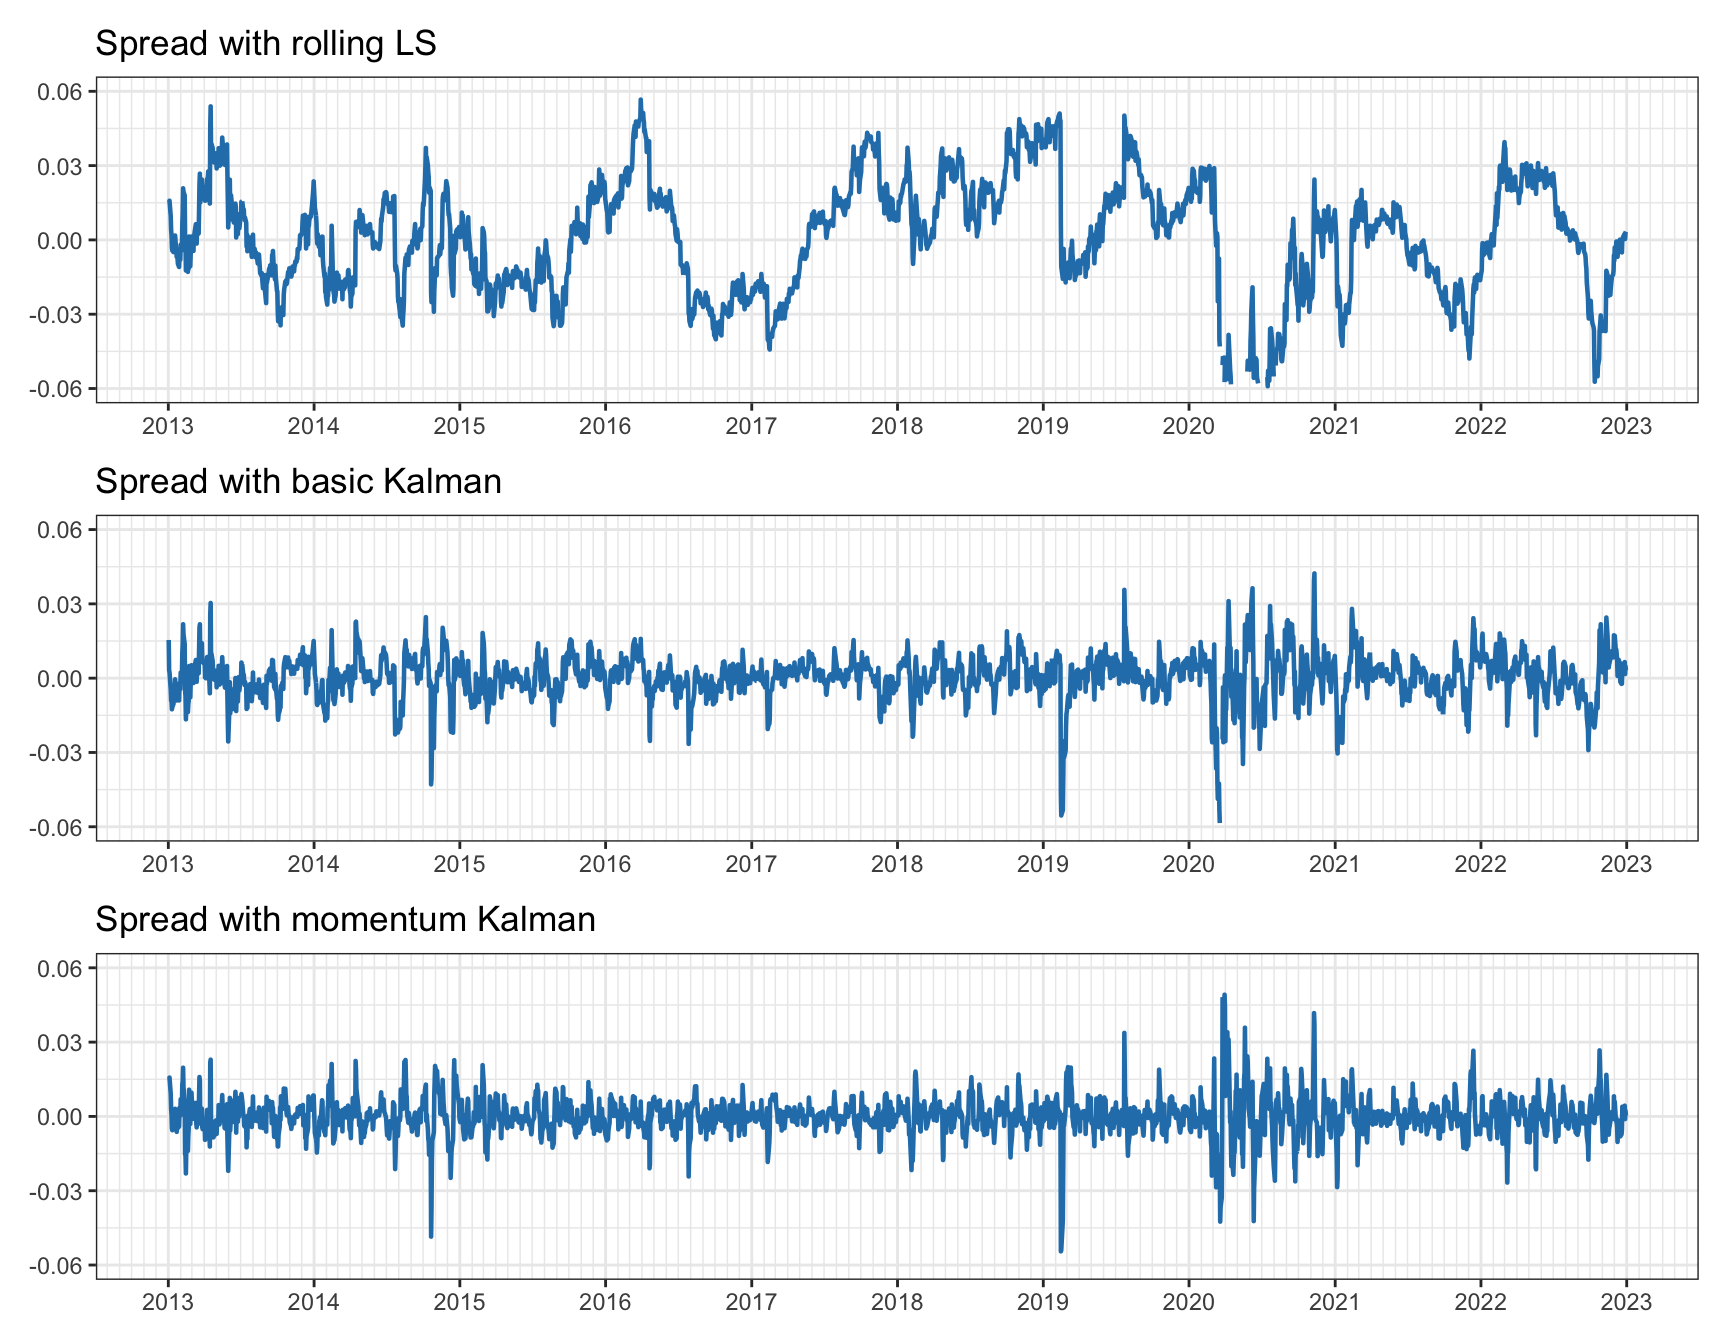
Figure 15.25: Spread for pairs trading on KO–PEP.
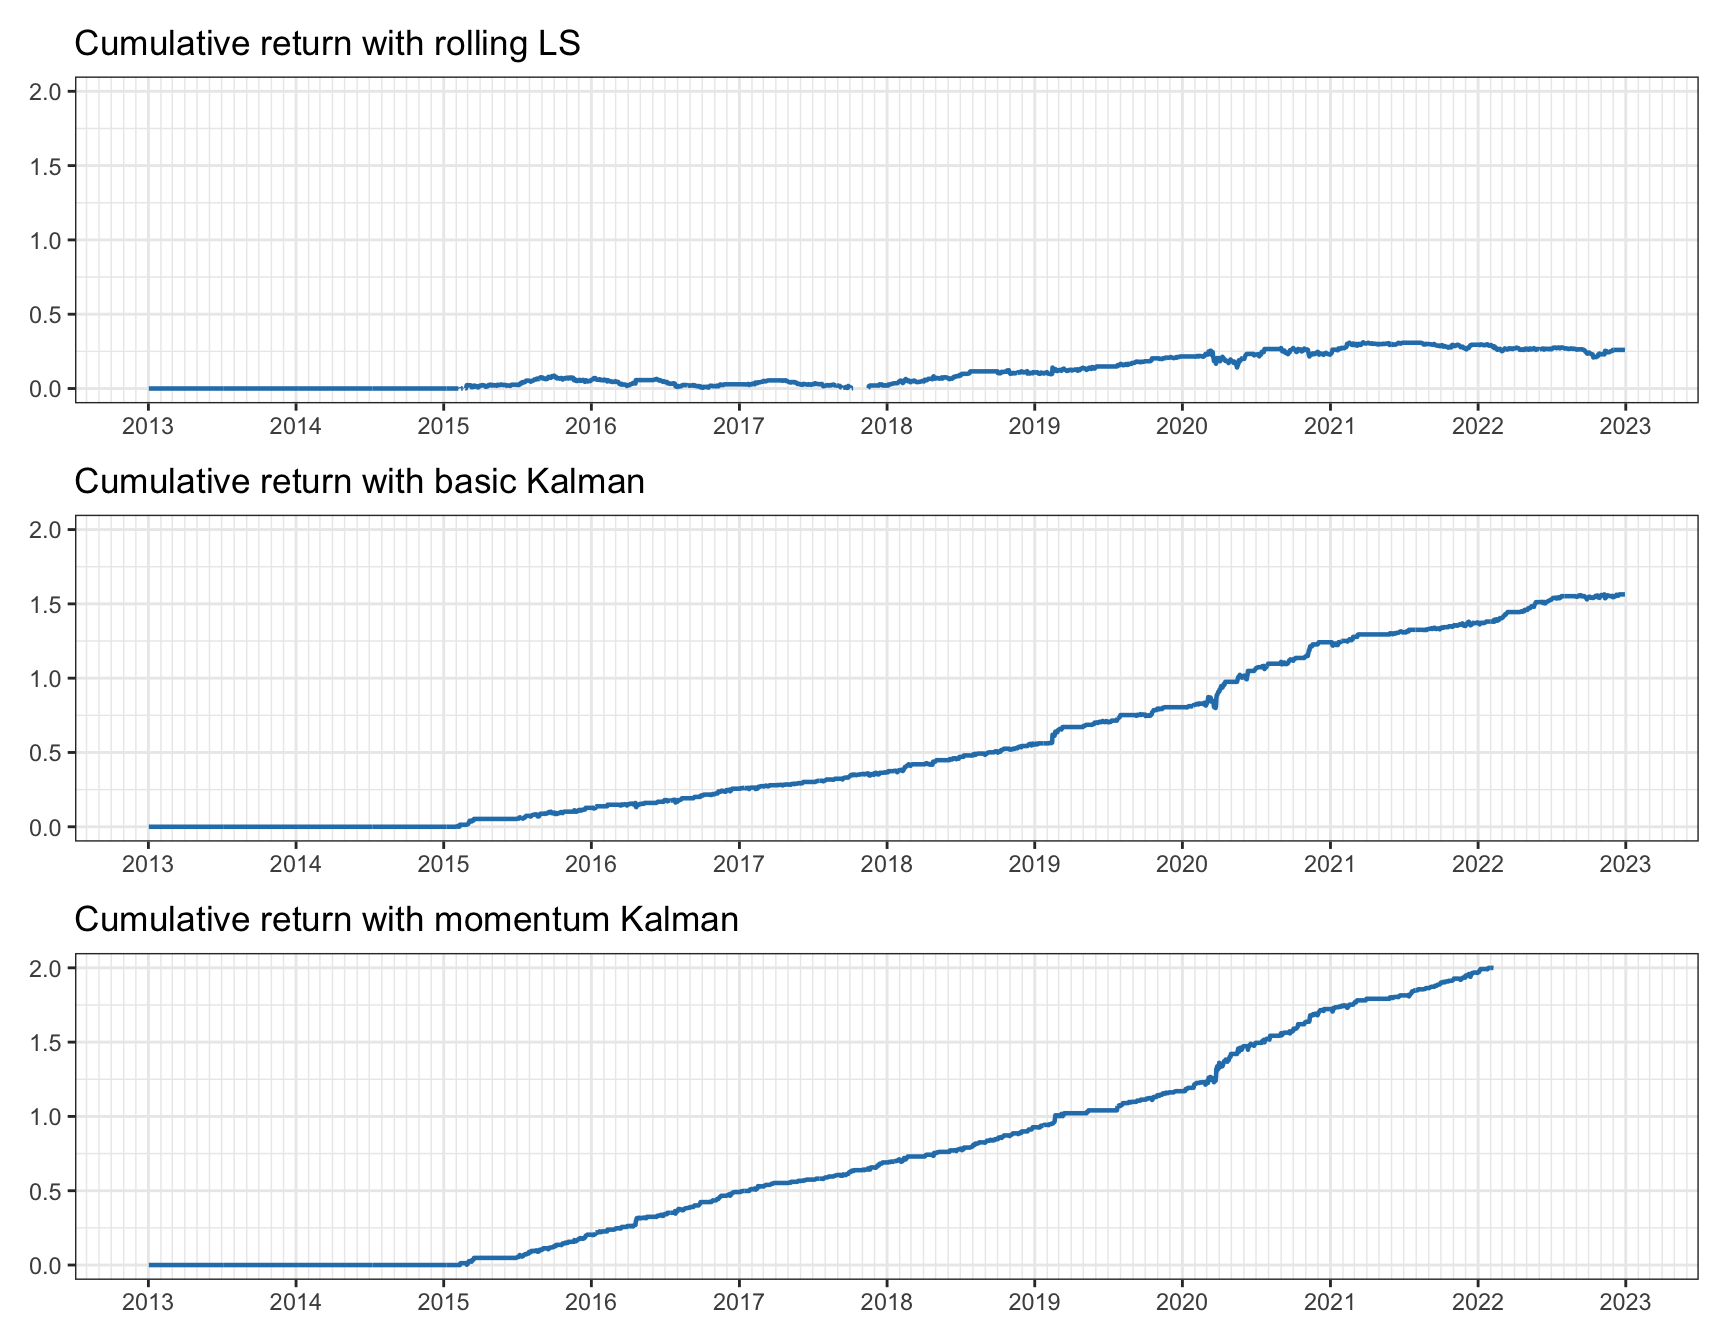
Figure 15.26: Cumulative return for pairs trading on KO–PEP.
References
The Kalman filter is implemented in the R package
KFAS(Helske, 2017) and the Python packagefilterpy. ↩︎The R package
MARSSimplements algorithms for fitting state-space models to time series data (Holmes et al., 2012). ↩︎